Transcript
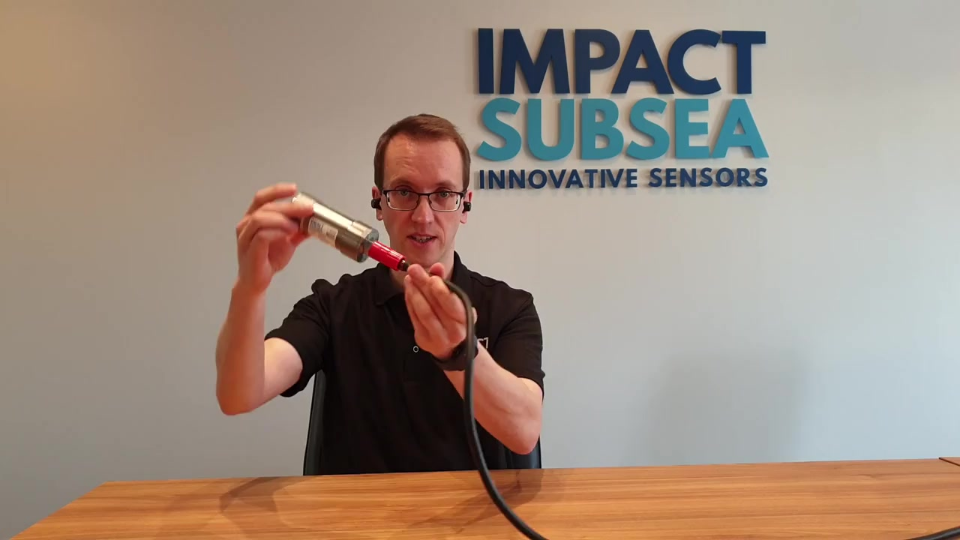
Hi, welcome to this video covering the use of two Impact Subsea Profiler Sonars.
Shown on the screen is our seaView Software and seaView has automatically detected two profilers connected to the computer. When you first run seaView it’ll scan all your comm ports and all network connections looking for Impact Subsea sensors. In this case it’s identified two profilers.
To start the profiling process simply double click on one of the profilers. It’ll take you into the ISP360 profiling application. The profiler sonar will automatically start to scan and generate profiling points on screen. The default settings for the profiler is a 90° profiling window and a 10m range and 0.4m minimum range.
A number of these settings will need to be adjusted to suit the profiling application being undertaken. To add a second profiler to the system we go to the profiler setup settings button, click on that. This will bring up the window showing all profilers currently connected to this application. If we click the green plus button to add a profiler it’ll add a second profiler display to the window. At this point we can allocate a profiler to that display. It will allocate the second profiler. As soon as that is allocated, it’ll start to scan and generate data points on screen.
When you add a second profiler sonar it automatically adds offset of 10m so this needs to be adjusted to reflect the actual physical offset between the two profilers. In the test setup we have here, we’ve set a 1.46m offset between the two. Entering that offset will bring the two profiler images together and overlap the data accurately. By default, when you’re doing a survey or say a pipeline survey, the two profilers should be mounted side by side with the notch mark on the end cap pointing directly towards the seabed.
If there’s any angular error in this installation, potentially one of the profilers is rotated slightly you can enter a rotational offset here to correct for that misalignment. Our particular installation here we’ve got a misalignment in profile two of 3° so I’ll enter in a 3° offset here and it’ll just rotate the data by 3° which will give us a more consistent overlap of data and the seabed will look flat.
At this point we’ve got the two profile running, we’ve got the offset between them input and any rotational corrections added. By default the first profiler sonar points are all red and the second profile points are all green if you’re not happy with the colors you can click on the color and you can edit it in the color editor to any color of your choice.
At this point the two profilers are set up to run together so we can close down the profiler setup window. Down at the bottom of the screen you can configure each of the profilers. The first drop down to look at is all, profiler one, profiler 2. If it’s selected all, then any adjustments you make to the gain, the speed, the frequency, will automatically be set in both profilers at the same time.
If you want to make an adjustment to just one of the profilers you can select the profiler you want to make adjustment to, adjust the range, speed etc. Then you go to the second profiler and make any tweaks there. To get set up quickly you generally want both profiler sonars to have a similar setup so we’ll select all and we’ll set up our our ranges initially in this example here we’ve dropped two profilers into one of the Impact Subsea test tanks.
It’s a rectangular test tank. We’ve also dropped in a plastic pipe to simulate a pipeline sitting on the seabed. The pipeline we’ve or the plastic pipe we’ve put in is around about 2m away from the the profiler so we’ll set our minimum range to 1 meter as there’s nothing within a meter of the profiler which is of Interest so we don’t want any profiling points within a meter and we’ll bring our maximum range down to 2m. So that should give us everything that we’re interested in.
At this point we’ve got the two profiler sonars set to give us the the minimum range want and the correct maximum range. At this point we want to introduce an energy threshold so right now the energy threshold is set to zero which means the profilers are digitizing every Echo they hear back. We’re in an acoustic test tank which makes it quite acoustically noisy as sound bounces around so what we want to do is we want to increase that threshold basically to remove the weaker echoes in the tank and just leave us with the the stronger data, data we’d actually want to log an output for survey purposes.
At this point we can see the the wall of the tank and we can see the pipe sitting there as well. We’re getting quite nice data. You might want to fine tune each profiler sonar to get more points so for example if we go to profiler one, we can adjust the energy threshold, maybe just slightly down, just to give us a few more points off the tank wall.
The profiler two looks pretty good, we can also adjust the the gain now. This gain here only applies to the imagery on screen at the moment we’ve only got profiling data so the profiling data is the data which is output from the system to survey or to a log file.
We can also view the raw acoustic imagery. You click on display options and go to show image you’ll see the full acoustic environment which the profiler sees. At this point the the gain on screen can be adjusted. You’ll see the gain change, put it back to both profiler sonars we adjust the gain on both the images at the same time. You can also change the threshold for the background imagery, increase the contrast and you can change the the palette as well if you’re not happy with the the colors. Once you’ve got that, you can turn off the imagery and just view the raw profiler points.
Something else to be aware of so we’ve got the two profilers set up in the profiler setup here and if you click on the settings of either of the profilers you can actually get into more detailed settings for each profiler. One is the profiling setup so both profiler sonars are set to operate on strongest echo just now but what I want to discuss here is the acoustic setup.
If you leave acoustic set to Auto as you adjust the range of the profilers the acoustic settings will automatically be adjusted in the background by the software, that’s probably the best thing to do. One thing to bear in mind when you’re running two profilers is you want to set one profiler to have Mode A, IS³ Acoustics, the second profiler to have Mode B, IS³ Acoustics. This will assure that the two profilers do not interfere with each other as they’ll be using different signaling schemes.
That’s the two profiles drawing together gathering data. The data looks pretty nice, pretty clean so at this point we’d probably want to output that data either to a log file or to a third party computer or application.
You can configure a log or output data by clicking this button here and click add output, you can select from some of the predefined output strings. You can say whether you want to go to log file or comm port. We’ll set up for comm port here, triggered per ping, we’ll send it out COM3 and we’ll send it out to 115200. That’s set up and click on start output, it’ll output that data on that comm port.
That’s a basic overview of running two profiler sonars together, for more information on the ISP360 please go to www.ImpactSubsea.co.uk and there you’ll find a profiler page where you can download the datasheet, manual and other technical information.
► OUR PRODUCTS ◄
► SUBSCRIBE ◄
► LETS CONNECT: ◄
► GET IN TOUCH ◄
EMAIL: info@impactsubsea.co.uk
PHONE: +44 (0)1224 460 850
Monday – Friday, 9AM – 5PM GMT