")


Transcript
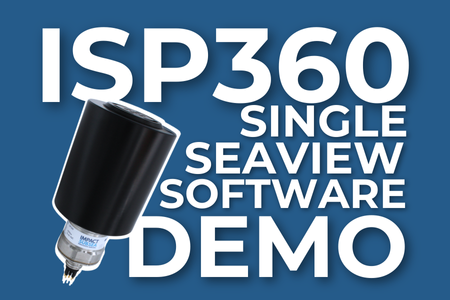
Hi and welcome to this video which provides an overview of the ISP360 Profiler Sonar application within the Impact Subsea seaView Software.
Shown on the screen here is an example of what you’ll see when you first run seaView. On the left hand side you have a list of applications which are installed in seaView, in the middle of the screen you have any devices any Impact Subsea sensors which have been detected and on the right hand side of the screen we have a list of any communication ports and network ports which your computer has.
Now when seaView first runs it’ll automatically scan all communication ports at every known baud rate and your network as well for any Impact Subsea sensors. So this has happened and we’ve got two Impact Subsea ISP360 profilers that have been detected.
Shown here are the two tiles for them and so tiles give you some information about the the sensor connected, it’ll tell you the serial number, the firmware on it, it will also tell you how it’s been connected and both of these profilers are connected over our Network so we can see the IP address which both profiler has.
Now to start using the profiler you simply double click on the profiler and in this example we’ll use number 11 here and double clicking on the profiler, it will take you straight into the ISP360 profiling application and the profiler will automatically start to scan and generate points on screen. Now in this example here we’ve deployed the profiler into the Impact Subsea test tank which is a rectangle test tank so we’ll be getting imagery from that today.
Shown on the screen just now we can see the profiler scanning away. Right now it’s doing a sector scan of approximately 90° and it’s got a range of 10 m set. In the middle of the screen you’ve got your raw data on the right hand side of the screen you’ve got got any attitude data so the pitch and roll the sensor at the left hand side you have a number of settings and down at the bottom you’ve got the most common settings that you’re likely to need to change as you set up a profiler for a particular application.
I’ll run through the common settings initially. The first is you can select which profiler these apply to. Now in this example here we only actually have one profiler connected but if you have multiple profilers connected you can select all if you want the settings to apply to every profiler or you can select the individual profiler if you want to set up individual settings for each one. We’ll leave it set to all just now.
Gain adjusts the imagery on the screen. Right now we don’t have any imagery purely showing profiler points we’ll come back to Gain in a little while. Next you have the resolution setting so you can move this from Speed to Quality. If you move it towards Speed the profiler will take physically larger steps as it scans. It’ll scan very quickly on a 7.2° step. If you move it up towards Quality the profiler will take smaller and smaller steps. Right now set it to 0.225° so it’s taking a very fine steps and it’s generating a lot of points.
Then we have the frequency toggle so the ISP360 profiler is a wide bandwidth sonar you can run it anywhere from 650 khz up to 1.25 MHz when you’re running at 650 khz the profiler has a 2° conical beam and it’ll get longer range. When you run at 1.25 MHz the range comes down but the beam comes down as well down to 1° so you get a higher resolution imagery. You can toggle between the two frequencies just by moving that slider.
Next you’ve got a Bins and Sector, this is where you can manually adjust just the the sector if you want a very particular sector for the profiler to scan over. You can also set the number of Bins which are shown on screen. This is purely the number of samples which are shown on the the imagery on the screen itself.
You also have the option of Use Flyback. When Use Flyback is selected the profiler will scan one way and then fly back and then scan again so you can see that happening just now, it’s scanning one way, then it pauses, the transducer flies back to the right hand side and it scans again. If we disable Use Flyback the profiler will scan back and forth so you can see it continues to scan and generates points both directions.
The last box here is a quick sector selection so you can quickly tell the profiler which direction you want to profile around. By default the profiler I will start pretty much as shown on the screen here and it’s scanning about the North marker on the profiler itself but we can adjust this so if we wanted to do a full 360 degree scan so get points generated all around the profiler we can quickly adjust it to do just that. Lets drop the quality down a little bit so it takes bigger steps, generates points more quickly.
Down at the very bottom of the screen we have some more settings, the first is minimum range. The minimum range anything below this value the profiler will ignore and so generally it’ll be set to around .4 as that’s the minimum range the profiler can start generating points from but it’s a means to gate your data so if you know that the target you’re wanting to profile is say more than a meter away you can increase this to 1 meter and then it won’t generate any points within 1 meter of the profiler.
Likewise you can adjust your maximum range, right now it’s set to 10m but our tank is not 10m wide so we can reduce the range here down to a more shorter range, let’s say 3.5m that way we can get a closer look at our tank.
The last setting down here is energy threshold so the energy threshold allows you to dictate how many points are on the screen. So a threshold of zero, it’ll show you every single acoustic return that it’s detected and some of that may be noise so we’re getting a little bit of noise in the tank just now so what we can do is we can increase the energy threshold.
Increasing the energy threshold will remove the weaker profiling points and you can push that up until you’re at a point where you’re quite happy with the data you’re getting, you’re getting all correct data and there’s very little noise present. If you push it up too far you’ll find it removes a lot of the data and only the very strong returns will be left and so it’s good to adjust that to make sure that you’re happy with the data level.
Once you’re happy with the data level and you’ve got your required sector scan at that point you can set up an output from the profiler either log the data to a log file locally on computer or you can set up an output string to go out to a survey computer for external logging and external processing.
They’re the key settings that you’re likely to change on a day-to-day basis, just as you’re working through a project. The other settings you have down the side here, the very top one is the main settings for the profiler sensor itself. If you click on that, you bring up the profiler setup so this is the profiler we have here.
Here we can tell the depth it’s at, any rotation, we can add in here, if you’ve mounted the profile with a slight physical offset either on purpose or by accident, you can put in a manual rotation. It’ll just rotate all the imagery on the screen. This is particularly useful if you multiple profilers and you’re trying to overlap the imagery and ensure everything aligns up correctly.
You can also go into the settings of the profiler from here. These settings pages are similar to the other Impact Subsea sensors. The first is the Acoustics side so in here you can set this to Auto and it’ll adjust the Acoustics automatically for the range that you set. If you disable the auto function you can go in there and manually edit the Acoustics so you can edit the frequency it’s run at, you can change it to be a CHIRP you can change pulse length, pulse amplitude etc.
In general, unless you’re wanting to experiment with Acoustics or you’ve got a good understanding of Acoustics it’s best to leave that just checked to Auto, that way the Acoustics will be automatically adjusted for you and if you have multiple profilers the Acoustics will be adjusted accordingly.
You can also set your speed of sound here, you can select whether 16 bit or 8 bit data is used this is not so relevant if you have an ethernet connection but potentially if you’ve got a serial connection of quite low bandwidth you can drop the data down to 8 bit data. That will just speed up the the scan rate of the profiler. You can mirror the sonar image, so mirror sonar image by default the imagery on screen assumes that the profiler has been installed that way up.
If you select mirror sonar image, it tells the sonar that it’s been installed upside down. Mirror sonar image is selected just now because the profiler in the tank has been installed upside down.
The last acoustic item to cover here is we’ve got the IS³ mode. If you click on there you’ll find there’s Mode A and Mode B. Generally if you’re running just one profile at a time leave it set to Mode A. If you’re running two profilers have one profiler set to Mode A and the second profiler set to Mode B. This will reduce the interference between the two profilers, allow them to run together with minimal interference.
The next option you’ve got here is IS³ signaling scheme so you can adjust this to have a bias towards giving you the highest resolution of data or you can reduce it down to give you the longest range capability. If you go for the highest resolution data basically it sends a a longer, more complex code. It allows you to get a little bit better timing accuracy and it gives you a higher resolution of data. If you move it down towards range the code becomes shorter and simpler and extends the range out to the profiler. For most applications where you’re working under 10m in range it’s best just leave it set to the highest resolution setting.
Here you can also change the connection settings so you can change the communications mode of the profiler from RS232 to RS485 or RS485 Terminated where it’ll add the termination resistor automatically within the profiler itself. You can also set the baud rate. For maximum scanning speed you want the highest baud rate but if you’re running over very long length of twisted pair or older degraded twisted pair you may need to reduce that baud rate in order to maintain stable communications. If you’re running the profiler over a network you can set up the IP address, subnet mass, gateway etc.
Connection mode, if you’re running onto a network where IP addresses are automatically given, you can click use DHCP that will fit into the the network you’re connecting to. There’s other profiling options here. The first is the echo mode so when the profiler sends out a ping you can choose whether it Triggers on the first Echo it sees back or the strongest Echo.
The first Echo will trigger on any echo which comes back first so it might be the the target you’re looking for but it could also be a fish or suspended sediment or anything else which is in the water between the profiler and the target. If you select strongest Echo it’ll send out a ping it’ll listen to every single echo which comes back across the range I’ll pick the one of the highest amplitude which will generally be the target you’re looking for.
In this window you can also turn gating on and off so gating will speed up the profiler by telling it that you want to scan to a particular range. If you set the profiler to say a 1m range and you turn gating mode on, it’ll scan to 1m directly below it it’ll maintain that same 1m distance across the whole sector of the scan so if you do a 90° sector scan it’ll be one meter there and it’ll create 1m out to the end of the 90 it almost creates a rectangular range.
In the AHRS settings here you can tell the profile exactly how it’s installed for the purposes of giving you pitch and roll data so you can tell it, it’s inverted as we’ve shown here. You can change it to default if you want that way put around the other way this basically just changes the reference point from which pitch and roll are read. Any offsets on the the pitch and roll you can also enter in here as you’re using the turns counter you can also set up where count turns around.
That’s all the the main settings there so if we go back to the the main page here one other thing to show you actually is the the point color you can change the color of the points shown on screen so by clicking there and selecting a different color you can choose virtually any color that takes your fancy.
We’ve closed down the profiler setup the other options you’ve got down side here is you got pause and run and you can reverse the direction of the scan by clicking there. Here importantly you can set up your log format and output data.
If we click on this button here, at the moment we’ve got no outputs there’s nothing being output from the computer so we can click on Add Output and this will allow us to configure an output string. There’s several default strings in there, there’s Impact Subsea profiler string and the exact detail of that string that ASCII string is detailed in the ISP360 manual so if you have a look there you’ll see the the detail of that.
We can select whether this is saved to a log file or output on a comm port and if it’s output on the comm port you can set up the comm port and the baud rate and then you can click start output. It’ll start outputting that data you can see the data being output there as the profiler scans round. That’s raw profiling data which you can then utilise for servey purposes. If you want to stop the output just click stop and it’ll stop the data being output.
Going back to the settings here we’ve also got clear image if you click that it’ll just wipe the image on screen and start repopulating it with new data. You’ve got display options so this allows you to turn on and off various different parts of the display so you can turn on off the polar grid you can turn off the scan line if you wish and this one here is quite interesting this is the show image so if you turn show image on it will show you the raw sonar data kind of like Imaging sonar data, so you can see the raw acoustic environment which the profiler is operating in and it can help understand why it’s digitising certain points.
You can turn on of the coordinates if coordinates are on you get this little coordinates detail down here just showing where the cursor is located on the screen. You can turn on and off an XY grid, the scaling will be automatic but you can turn scaling off if you want to make the the grid smaller or finer.
You can adjust the point size here so you can make the profiler points smaller, it’s in pixels, or you can make them larger, really just to suit the display you’ve got and how big or small you want the points.
You can turn on and off the range display from the polar plot. You can turn the palette off from the left hand side you can turn the smoothing on and off smoothing and palette they really just refer to the image here so they affect how the image looks.
If you’ve got GPS feeding into the system you can turn the GPS display on off. You can also turn on and off the AHRS if you don’t want the pitch and roll showing from the profiler you can turn them on and off can also turn on and off the individual components of that as well.
If you’ve zoomed in to point to the display there’s a quick way to zoom back out again which is to click there and you can manually zoom in manually zoom out there you can also zoom in and out just by scrolling the mouse wheel as well which is often the easier option.
If you want to take a quick measurement on screen you can click the measurement tool and simply drag it across the screen like that and you can take a quick measurement so you can check measurements as they are on screen rather than trying to manually judge it.
If you’re doing a a pipe profiling application and you can turn on and off a pipe on screen which will allow you to place an overlay on the pipe which is being scanned.
If you have the imagery showing on screen you can adjust the color palette here so you can change it to different color palettes you can also adjust the threshold or the contrast there and the threshold here so adjust the imagery to suit. Of note the imagery shown on screen doesn’t affect the raw profiler output. This change here that’s purely a visual change, it won’t change the data being output from the system the data output from the system is basically all the digitized points that are shown on screen.
Other than that you can do a general log file you can start logging data here and you can save it to a log file. This will be saved in the Impact Subsea proprietary standard. This type of logging is really just to save the log file for replay through seaView again later on. Of note if you do save the log file here and then when you go to replay the log file you can then set up an output from that log file through a comm port or to a survey so there is always a means to extract the data out with seaView.
You can also open logs from here you can open previously save logs and replay them. Any notifications that seaView receives will be shown here so if you start logging, close logging, if a device is connected, if a device has got bad comms, maybe it’s a broken cable etc, you’ll get notifications here. which will guide you on what might need to be checked or inspected.
You can take a screenshot at any point so if there’s something on screen that’s of Interest, click the screenshot button, you can give the file a name, click the tick and it will save that image to your computer.
You can click this button to go full screen so it’ll just go to the full screen of your monitor and you’ve got another settings button here which is really to do with the seaView itself. Here you can set up where screenshots are saved, where log files are saved, which units you want to use, whether it’s a metric or imperial measurement system, any licenses you can activate here. There’s no licenses for the profiler and so this is really for FMD and ECHOGRAM and other sensors that we have.
You can select the styles you can change seaView from a dark theme to a light theme if you want. You can also adjust the font size of everything on screen so depending on the resolution of your monitor you can adjust things to look exactly as you like them. If you click on system, it’ll give you the system information so it’ll tell you the exact version of seaView and a few other details there if ever you have a technical question or a support issue, our team may ask you for this information just so we fully understand which version of seaView you’ve got.
Lastly if you click on the Impact Subsea icon it’ll take you to our website and on our website you’ll find more information about all of our sensors in terms of the ISP360 profiler, you’ll find the datasheet, the manual, 3D models of the device. If you want to have them to integrate into a model of your vehicle and more technical information as well.
For further information on the ISP360 please see our website at www.ImpactSubsea.co.uk
► OUR PRODUCTS ◄
► SUBSCRIBE ◄
► LETS CONNECT: ◄
► GET IN TOUCH ◄
EMAIL: info@impactsubsea.co.uk
PHONE: +44 (0)1224 460 850
Monday – Friday, 9AM – 5PM GMT